Python Debugging/ja: Difference between revisions
No edit summary |
No edit summary |
||
| Line 1: | Line 1: | ||
Pythonはオープンソースのスクリプティングエンジンです。このエンジンに接続してデバッグ可能な、多くの無料および有料のIDEが存在します。インターネットでそれらを検索して試してみることができます。さらに簡単なデバッグの方法が見つかるかもしれません。 | |||
{{LocationMain|category=LocationPYSpecial|specific=}} | {{LocationMain|category=LocationPYSpecial|specific=}} | ||
<div class="rightmenu"> | <div class="rightmenu"> | ||
| Line 6: | Line 6: | ||
== Aptana Studioでのデバッグ == | == Aptana Studioでのデバッグ == | ||
ここでは、[http://en.wikipedia.org/wiki/Eclipse_(software) Eclipse]のバージョンである[http://www.aptana.com Aptana Studio] | ここでは、[http://en.wikipedia.org/wiki/Eclipse_(software) Eclipse]のバージョンである[http://www.aptana.com Aptana Studio]を使用します。 | ||
ApatanaはPythonプロジェクトの管理が行えるIDEです。また、Vectorworksのようなリモートのpythonエンジンをデバッグできます。これには、Eclipseでpythonを実行するプラグイン[http://pydev.org/ PyDev]が含まれています。 | ApatanaはPythonプロジェクトの管理が行えるIDEです。また、Vectorworksのようなリモートのpythonエンジンをデバッグできます。これには、Eclipseでpythonを実行するプラグイン[http://pydev.org/ PyDev]が含まれています。 | ||
| Line 15: | Line 15: | ||
== Aptanaを設定する == | == Aptanaを設定する == | ||
# | # Python 3.3 runtime ([http://www.python.org/download/ download])をインストールします。 I’ll hook Aptana to this version later. 技術的には必要ありませんが、こうすることで編集中にApatanaがシンタックスエラーをレポートすることができるようになります。 | ||
# | # Aptana Studio 3 ([http://www.aptana.com/products/studio3/download.html download])をインストールします。 | ||
# | # Aptanaは多くの言語をサポートしています。最初だけ、Pythonインタプリタ(the above mentioned [http://en.wikipedia.org/wiki/PyDev pydev] plug-in)を設定する必要があります: | ||
#:* '''Preferences > PyDev > Interpreters > Python Interpreter''' | #:* '''Preferences > PyDev > Interpreters > Python Interpreter''' | ||
#:* click on '''Advanced Auto-Config''' | #:* click on '''Advanced Auto-Config''' | ||
Revision as of 01:25, 15 December 2017
Pythonはオープンソースのスクリプティングエンジンです。このエンジンに接続してデバッグ可能な、多くの無料および有料のIDEが存在します。インターネットでそれらを検索して試してみることができます。さらに簡単なデバッグの方法が見つかるかもしれません。
.Python|Python ..VS:Function Reference|Function Reference ..VS:Function_Reference_Appendix|Appendix ..Python Debugging|Debugging with Python
Aptana Studioでのデバッグ
ここでは、EclipseのバージョンであるAptana Studioを使用します。
ApatanaはPythonプロジェクトの管理が行えるIDEです。また、Vectorworksのようなリモートのpythonエンジンをデバッグできます。これには、Eclipseでpythonを実行するプラグインPyDevが含まれています。
リモートデバッグの方法についてはこちら: http://pydev.org/manual_adv_remote_debugger.html
Aptanaを設定する
- Python 3.3 runtime (download)をインストールします。 I’ll hook Aptana to this version later. 技術的には必要ありませんが、こうすることで編集中にApatanaがシンタックスエラーをレポートすることができるようになります。
- Aptana Studio 3 (download)をインストールします。
- Aptanaは多くの言語をサポートしています。最初だけ、Pythonインタプリタ(the above mentioned pydev plug-in)を設定する必要があります:
- Preferences > PyDev > Interpreters > Python Interpreter
- click on Advanced Auto-Config
- select the Python 3.3 you just installed in step 1. We wont actually use it, but will let Aptana use it to syntax check.
- See Configure Interpreter in the pdev documentation for more infos.
- Specify a Workspace: the directory where you store your Projects, in our case the plug-in folders with the code. Depending on Aptana's defaults, the application will prompt you with a workspace choice at every launch:
- When prompted at start: choose a directory outside any Vectorworks path.
- When you need to manually change the path: File > Switch Workspace > Other...: choose a directory outside any Vectorworks path.
- Mac Example: <User>/Documents/Python_VW
- This is VERY important for the reason that a workspace directory will contain a ton of files that start with ‘.’. If this path is visible by Vectorworks, it will make it launch very slowly (from traversing all these files and sub-folders). Also take care to select a directory with proper read/write user rights, for example within the folder "Documents".
- Note: you can have multiple workspaces. The list will be visible here: Preferences > General > Startup and Shutdown > Workspaces
- Now, you can create or import a Project: a directory containing all files needed for a plug-in, for example the folder Python Sample Menu Command.
- Import an existing Project (for example the Python Sample Menu Command): File -> New -> Project... > General
- Create a new python Project: file > new > project > PyDev > PyDev project
- See Creating a Project in the pdev documentation for more infos.
VWを設定する
デバッグの方法として、Apatanaのリモートデバッガを使用します: http://pydev.org/manual_adv_remote_debugger.html. VectorworksでPythonの正しい環境パスを設定してください:
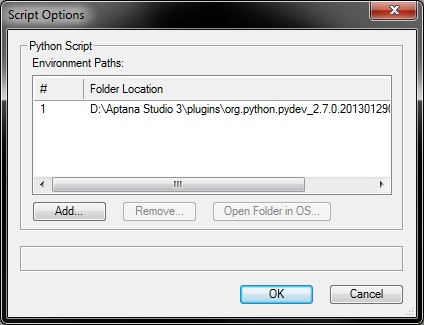
- Vectorworks menu Tools -> Plug-ins -> Script Options : add an environment path to the needed Folder location:
- Win example: D:\Aptana Studio 3\plugins\org.python.pydev_2.7.0.2013012902\pysrc
- Mac example: /Applications/Aptana Studio 3/plugins/org.python.pydev_3.0.0.1388187472/pysrc
- Note
- You may need to change that to the place where you have installed the Aptana Studio application.
- Vectorworks menu Tools -> Plug-ins -> Script Options : add an environment path to the needed Folder location:
- Include an import to the PyDev remote debugger in your script. The Python Sample Menu Command contains commented code that enables PyDev debugger:

import pydevd
pydevd.settrace(suspend=False)
- 注意
- スクリプトが失敗した場合は「pydevd」モジュールが見つからないのが原因です。環境パスでVectorworksのPythonを指定して、モジュールを見つけられるようにしてください。
リモートデバッガを有効にする
Then you go to Aptana Studio and enable the remote debugger (instructions under http://pydev.org/manual_adv_remote_debugger.html) and run your script in Vectorworks. You may need to enable the Debug perspective in Aptana before being able to enable the debug server, or the mentioned "green button" of the instructions will not be available:
- Enable the Debug Perspective view:
- Window > Open Perspective > Other > Debug: a new icon with a green bug will appear on the rightmost corner of the window (see screenshot below), this toggles the debug perspective
- Start the remote pydev debugger server: click on the green button with the bug and a P, which you'll find about the middle of the window (again screenshot below)
関連項目
Python basic information: Python